📊 Setup and Check Analytics
Written By Ashish Mishra
Last updated 10 months ago
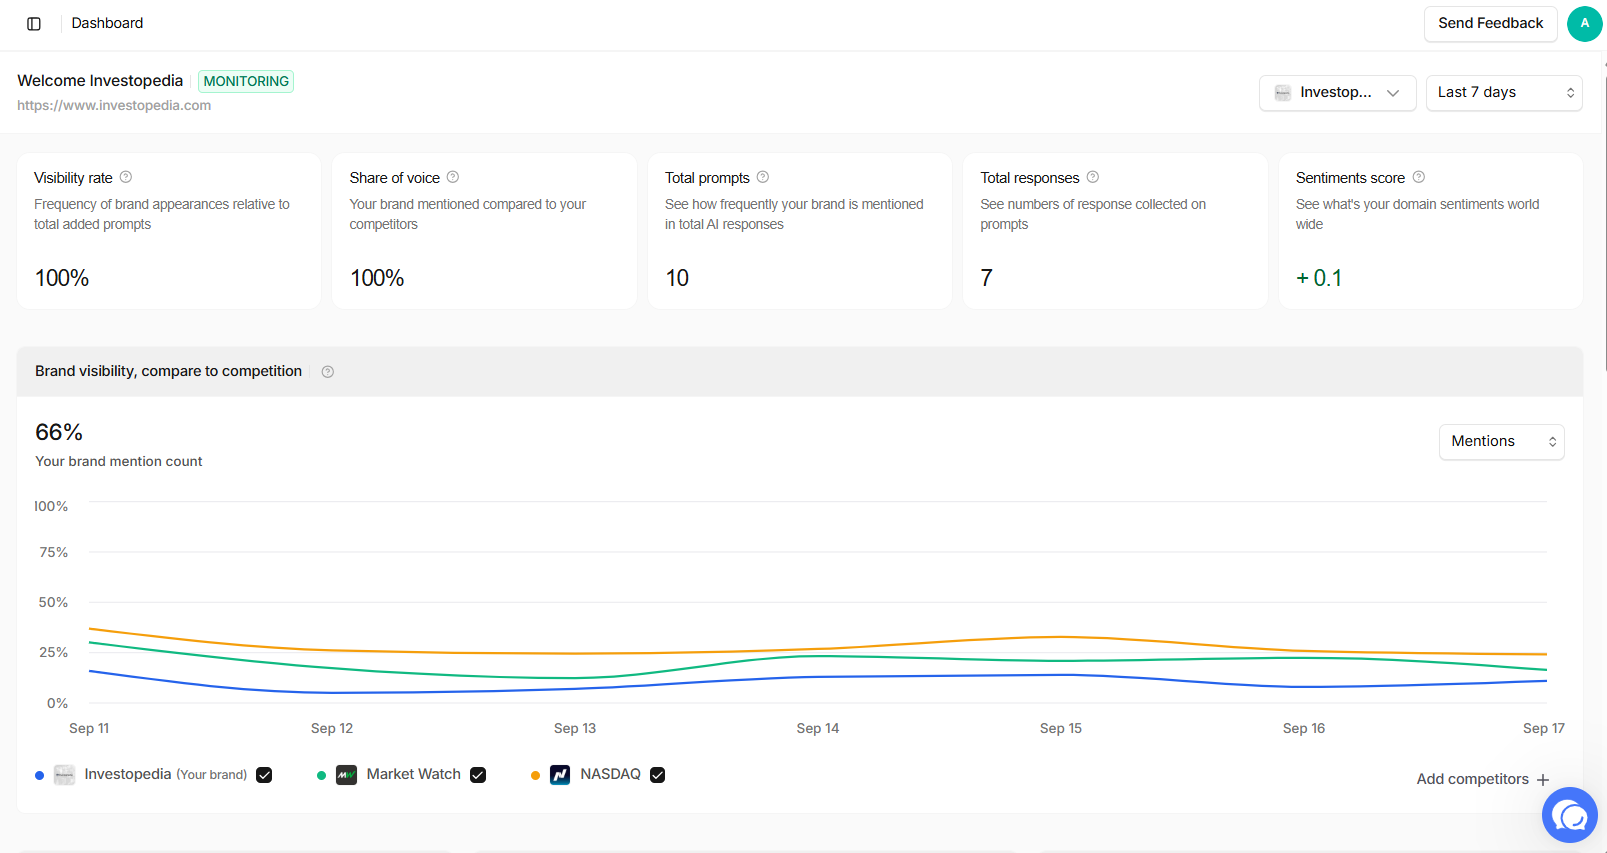
The Analytics Dashboard gives you full visibility into how AI engines perceive your brand over time.
Key Panels:
Visibility rate = The percentage of AI responses that mention your brand.
Share of voice = the percentage of AI responses that mention your brand compared to competitors.
Total prompts = Number of Prompts you are monitoring currently
Total responses = total number of responses you have received for the listed prompts
Sentiments score = Summation of Sentiment score across all prompts and responses
Brand visibility (Compare to competition) = Track your brand mention trends and compare against competition
Overall visibility across models = The percentage of visibility based on the prompts response, aggregated data.
Overall sentiments share = Overall sentiment distribution across brand mentions
List of Sources mentioning you = Sources which are mentioning you in AI response
Recent chats = Recent AI responses for your organization
Filters Available:
Date range
Brand Section (Yourself + Competition)
Add Competitors
Export CSVs, generate weekly PDFs, or embed graphs into your Notion reports.